
by LLT | May 23, 2017 | LLT, News
 According to a recent report by Zillow, if American homeowners moved at the same rate they did in 1990, there would have been about 2.8 million more homes sold in 2016. This would solve the ongoing inventory problem, but the fact is Americans just aren’t moving, for a number of reasons.
Zillow cites three possible reasons for a non-moving population: an aging population, pockets of high negative equity, and an increase in single-family rentals. Zillow notes that the last factor, the increase in single family rentals, carries the most weight.
Elderly homeowners are the least likely to move, according to Zillow research, but the overall moving rate has been declining for all demographics. Additionally, the shifting age profile of the American population accounts for just one-fifth of the decline in the aggregate migration rate since 1990.
Another factor that may be weighing on inventory is negative equity. Following the housing crisis, many homeowners found themselves in homes worth less than their outstanding mortgage. This prevented plenty of homeowners from moving. Negative equity weighed especially heavy on the turnover rate in 2012 and 2013, according to Zillow. However, while negative equity was a major factor on the migration rate post-crisis, it still does not explain the current levels.
Zillow states that the heaviest factor weighing on inventory concerns is the rise in single-family rentals. Investors purchased numerous foreclosed homes in the post-crisis market and converted them into rentals. Since the recession, the share of single-family renters has increased from 12.7 percent in 2005 to 19.2 percent in 2016, while the number of owner-occupied homes fell by 680,00 in that same timeframe.
The higher amounts of rental homes means more options for homeowners and less for buyers, as rentals are put up for sale much less frequently. Zillow says that “the shift of single-family homes from the owner-occupied to the rental-occupied housing stock is a strong candidate to explain the structural shift in single-family home turnover, above and beyond the relatively minor demographic headwinds from aging.”
Read the full article.

by LLT | May 19, 2017 | LLT, News
 Sales to increase 3.5% this year
Single-family existing home sales are set to see their best year since 2006, driven by robust job gains and improving household confidence, according to the forecast from the National Association of Realtors.
While existing home sales are increasing, low levels of supply and rising affordability concerns are creating headwinds for sales and threatening the low homeownership rate.
The first quarter came in with the best sales pace for existing homes in a decade; NAR Chief Economist Lawrence Yun expects that pace to continue, finishing off 2017 with 5.62 million sales, the best pace since 2006. This would represent an increase of 3.5% from 2016.
And home sales aren’t the only thing predicted to rise. NAR also forecasts an increase of 5% in existing home prices in 2017.
However, starter home shortage continue to plague the housing market and discourage would-be first time homebuyers.
“We have been under the 50-year average of single-family housing starts for 10 years now,” Yun said. “Limited lots, labor shortages, tight construction lending and higher lumber costs are impeding the building industry’s ability to produce more single-family homes.”
“There’s little doubt first-time buyer participation would improve and the homeownership rate would rise if there was simply more inventory,” he said.
Yun predicted new home starts will rise 8.4% to 1.27 million in 2017. While an increase from the current pace, this is still 1.5 million homes below the amount needed to make up for insufficient building in recent years. New home sales are also expected to rise 8.4% from last year to 620,000 sales.
Jonathan Spader, Joint Center for Housing Studies senior research associate at Harvard University, joined Yun at the 2017 Realtors Legislative Meetings and Trade Expo to discuss the 2017 forecast. He explained the homeownership rate will hover between 61% and 65.1% as it faces headwinds such as an aging population, changes in family type and increasing diversity by race and ethnicity.
“Stagnant household incomes, rising rental costs, student loan debt and limited supply have all contributed to slower purchasing activity,” Spader said. “When the homeownership rate stabilizes, there will be an increase in homeowner households. Young and minority households’ ability to reach the market will play a big role in how much the actual rate can rise in coming years.”
But while home sales continue to rise to decade highs, economic growth is at its slowest since World War II. Mark Calabria, chief economist and assistant to Vice President Mike Pence, explained at the conference the housing market cannot be strong without a solid economic foundation.
“A strong labor market will drive a strong housing market, but you can’t have a strong housing market without a strong economic foundation,” Calabria said. “The recovery has been uneven with roughly 70 counties making up roughly half of all job growth.”
And while the first quarter gross domestic product did come in at a disappointing 0.7% growth, the second quarter will see an increase to about 2.2%, Yun said.
Yun predicts two more rate hikes this year to bring mortgage rates to an average 4.3% by the end of 2017, and climbing towards 5% in 2018.
“There was a lot of uncertainty at the start of the year, but a very strong first quarter sets the stage for a modest sales increase compared to last year,” Yun said. “However, prices are still rising too fast in many areas and are outpacing incomes.”
“That is why housing starts need to rise to alleviate supply shortages,” he said. “There will be more sales if there’s a meaningful bump in new and existing inventory.”
Read the full article.

by LLT | May 17, 2017 | LLT, News
 The percentage of U.S. mortgages in the process of foreclosure at the end of the first quarter fell to its lowest level since the first quarter of 2007, the Mortgage Bankers Association said on Tuesday.
The share of home loans in foreclosure was 1.39 percent in the first three months of 2017, down 14 basis points from the fourth quarter and 35 basis points lower than one year ago, the Washington-based industry group said.
“In addition, nearly all states had a decrease in the percentage of loans in foreclosure in the first quarter,” MBA’s vice president of industry analysis Marina Walsh said in a statement.
Other measures on homeowners’ creditworthiness generally improved in the first quarter, MBA said.
The delinquency rate for mortgages on one- to four-unit homes decreased to 4.71 percent in the first quarter, down 9 basis points from the fourth quarter and 6 basis points lower from a year earlier.
The percentage of loans on which foreclosure actions were started was 0.30 percent in the first quarter, up 2 basis points from the previous quarter, but down 5 basis points from one year ago. This was the first rise in foreclosure starts since the fourth quarter of 2014, MBA said.
The year-over-year declines in late payments and foreclosure actions on “conventional” mortgages that are guaranteed by Fannie Mae (FNMA.PK) and Freddie Mac (FMCC.PK) and ones backed by the Federal Housing Administration (FHA) and Veterans Administration (VA) stemmed from ongoing job growth and signs of rising wages, according to MBA.
“These fundamentals have helped to support the performance of all loan types – whether FHA, VA or conventional loans,” Walsh said.
Read the full article.
by LLT | May 15, 2017 | LLT, News
-
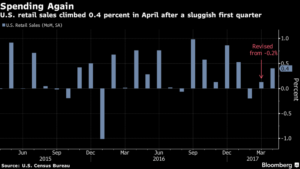
 Figures support idea that recent slowdown was transitory
-
Michigan consumer-sentiment gauge ticks up to four-month high
The U.S. economy is back on track for steady growth, though not much more.
Data released Friday showed consumer retail purchases rose last month, albeit less than forecast, after a March gain that was revised from a decline, indicating the early-2017 slowdown was transitory. The consumer-price index stabilized in April following the first drop in a year, though a gauge excluding food and energy posted the smallest year-over-year increase since October 2015.
The pickup in retail sales — with gains in nine of 13 major categories — eases concern from earlier in the year about a loss of momentum in household spending, the biggest part of the economy. The CPI results are a reminder that while businesses are regaining some pricing power, inflation is hardly breaking out.
Together, the data indicate progress consistent with the Federal Reserve’s view of the economy and inflation ahead of policy makers’ mid-June meeting, where they are widely expected to continue their gradual pace of interest-rate increases with a quarter-point hike. The Fed may feel less pressure, however, to pick up the pace should core inflation remain subdued.
“It’s a pretty decent overall picture of the U.S. economy,” said Sal Guatieri, a senior economist at BMO Capital Markets in Toronto. “Consumer spending is rebounding, though possibly not as much as we expected. On the inflation front, there’s not a lot of pricing pressure, and it looks like inflation is gravitating toward the Fed’s goal.”
A separate report showed that the University of Michigan consumer confidence index climbed to a four-month high in May, and within that, buying conditions for large household durables rose to the highest since 2005, reinforcing signs that Americans remain optimistic about spending.
“Today’s sub-consensus U.S. data is unlikely to rock the Fed’s boat, meaning there are increasingly few reasons for not hiking in June,” James Smith, an economist at ING in London, wrote in a note.
Continue reading.

by LLT | May 10, 2017 | LLT, News
-
 Mortgage application volume is still nearly 14 percent below year-ago levels because of weaker refinancing.
-
“Continuing strength in the job market and improving consumer confidence drove overall purchase applications to increase last week,” said economist Joel Kan.
The gains are slow and small, but mortgage volume is beginning to improve again, as more homebuyers sign on the dotted line.
Total mortgage application volume increased 2.4 percent on a seasonally adjusted basis last week from the previous week. Volume is still nearly 14 percent below year-ago levels because of weaker refinancing, according to the Mortgage Bankers Association .
Even as buyers complain of high home prices and limited listings, mortgage applications to purchase a home gained 2 percent for the week and are 6 percent higher than a year ago.
“Continuing strength in the job market and improving consumer confidence drove overall purchase applications to increase last week,” said MBA economist Joel Kan. “The index for purchase applications reached its highest level since the beginning of October 2015, which was the week prior to the implementation of the federal government’s ‘know before you owe’ rule.”
That rule had lenders concerned that compliance would delay the mortgage process, which it did for a short time. Demand for mortgages was likely high just prior to its implementation, as buyers rushed to get in and avoid those delays.
Mortgage applications to refinance a home loan rose 3 percent for the week but are still 32 percent below last year, when interest rates were lower.
The average contract interest rate for 30-year fixed rate mortgages with conforming loan balances of $424,100 or less remained unchanged at 4.23 percent, with points decreasing to 0.31 from 0.32, including the origination fee, for 80 percent loan-to-value ratio loans.
Mortgage rates have been inching higher in general and have only moved lower on three out of the past 15 business days, according to Mortgage News Daily.
“While that sort of losing streak sounds fairly unpleasant, the size of the movement has been far from threatening,” said Matthew Graham, Mortgage News’ chief operating officer.
Continue reading.

by LLT | May 8, 2017 | LLT, News
 Fed Funds Rate to level out at 3%
The Congressional Budget Office, which provides nonpartisan analysis for the U.S. Congress, released its 2017 Budget and Economic Outlook, which showed a forecasted nine federal funds rate hikes by the year 2020.
Wednesday, the Federal Open Markets Committee met, deciding not to raise rates again after having just raised them in the March meeting. However, housing experts explainedthat recent economic data supports the consensus that the Fed will raise rates in December and once more in 2017.
The CBO released a chart that shows interest rates will rise steadily, probably about three rate hikes of 25 basis points per year, and finally level out at 3% in 2020.
The current target range for the federal funds rate stands at .75% to 1%. The chart shows once the federal funds rate hits 3% in 2020, it will hold that pace for several years, remaining at 3% at least until 2027.
While 3% is a significant increase from today’s rate, the chart shows it is still substantially lower than the pre-crisis years between 2002 and 2007.
Read the full article.
 According to a recent report by Zillow, if American homeowners moved at the same rate they did in 1990, there would have been about 2.8 million more homes sold in 2016. This would solve the ongoing inventory problem, but the fact is Americans just aren’t moving, for a number of reasons.


Recent Comments