
by LLT | Apr 19, 2017 | LLT, News
 They’re either a valuable financial tool for homeowners or a harbinger of trouble on the horizon: Cash-out refinancings, which were wildly popular during the housing boom years and contributed to the severity of the crash, are on the rise again.
National mortgage investor Freddie Mac reports that 45 percent of all home loan refinancings in the final three months of last year involved cash-outs. That was the highest percentage since the end of 2008. Black Knight Financial Services, a mortgage technology and analytics firm, says homeowners pulled $31 billion from their equity holdings in the fourth quarter of 2016, a jump of 50 percent over the same period the year before.
In a cash-out transaction, borrowers come away with a new mortgage that is larger than the one being replaced. The borrowers pocket the difference between the old balance and the new mortgage amount and can spend it on anything they choose. In a simplified example, you could refinance a loan with a $250,000 balance, replace it with a $300,000 mortgage and walk away with $50,000, not counting transaction costs.
Much of the current cash-out surge is the result of steadily rising home prices and equity holdings since 2012. According to the Federal Reserve, American homeowners had more than $13.3 trillion in equity as of the end of last December, a $1.3 trillion jump over the same period in 2015. With more equity, rising numbers of owners have been attracted to the idea of using a cash-out refi to pay for remodeling their homes or consolidating high-interest credit card balances and other debts. Lenders don’t audit what borrowers do with the cash they pull out, so some of the money could well be spent on cars, overseas vacations or ongoing household expenses.
But when cash-out refis begin to soar, is that a positive or negative indicator for the housing market’s health? Critics such as Connecticut-based real estate analyst Keith Jurow say the trend today is reminiscent of the tail end of the boom years, and a little worrisome. Though banks and other lenders may have more rigorous underwriting standards than they did during 2003-2008, he says, they may be overconfident about how long housing price inflation will continue and how much of an equity cushion borrowers should be required to maintain. If too many owners get overleveraged, as millions did during the housing boom, any significant market downturn could spell trouble.
Continue reading.

by LLT | Apr 18, 2017 | LLT, News
 As mortgage applications increase, mortgage rates have begun to drop, according to data from the Mortgage Bankers Association (MBA) and Freddie Mac. The MBA’s Market Composite Index, a measure of mortgage loan application volume, rose 1.5 percent from a week earlier, while the 30-year fixed-rate mortgage dropped from 4.10 to 4.08 percent. The average loan size for purchase applications was at $318,700, a survey high.
The declining 30-year fixed-rate mortgage is at a 2017 low, according to Freddie Mac, but still higher than this time last year. During this week a year ago, the 30-year fixed-rate mortgage average 3.58 percent. Still, mortgage rates are declining, and may keep declining as applications increase.
Freddie Mac reports that mortgage rates are declining week-over-week, a trend that has continued over several weeks. Though early March saw a week-over-week jump, rates have declined since then, especially 30-year fixed-rate mortgages.
Other mortgages, such as 15-year fixed-rate mortgages, have seen week-over-week declines as well, though not as drastic. The average rate for a 15-year fixed-rate mortgage dropped from 3.36 percent to 3.34 percent week-over-week.
Additionally, the average contract interest rate for 30-year fixed-rate mortgages with conforming loan balances ($424,100 or less) decreased to 4.28 percent from 4.34 percent, with points increasing to 0.38 from 0.31 for 80 percent loan-to-value ratio loans. The effective rate decreased from last week.
As rates decline, refinances have declined with them. The refinance share of mortgage activity saw a decrease to 41.6 percent of total applications from the previous weeks 42.6 percent, according to the MBA. This is the lowest level since September 2008.
While 15-year and 30-year fixed rate mortgage application volume has declined, the MBA reports that adjustable-rate mortgages remained unchanged.
Read the full article.

by LLT | Apr 17, 2017 | LLT, News
 Median sale price increases 7.5% in the fastest market on record
Redfin reports that U.S. home prices rose 7.5% to a median sale price of $273,000 in March as home sales made a strong showing, gaining 8.9% over last year. However, the number of homes for sale declined 13% compared to March 2016, marking the 18th consecutive month of declines in supply.
The report indicated that 2017 remains on track to be the fastest housing market on record and the typical home that sold last month went under contract in 49 days, shaving 11 days from last year’s median time on market of 60 days. Nearly one in five, or 19.1%, homes that sold in March went under contract within two weeks and 21.7% of homes sold for more than their list price.
Four East coast cities saw inventory decline more than 30%. Rochester, New York, saw the largest inventory decline, dropping 39% since March last year. Buffalo, New York, saw a 34.5% decline, Rochester, New Hampshire, dropped 33.2%, and Portsmouth, New Hampshire dipped 31.4%. However, these areas also had fewer homes available on the market than last year.
A handful of cities did see modest inventory growth. Fort Myers, Florida, saw the highest increase in the number of homes for sale, up 32.4% from last year, followed by Knoxville, Tennessee, with 22.3% growth and Austin, Texas, which saw 10.3% growth.
“In addition to the laws of supply and demand, today’s open and immediate access to home listing information is really driving the velocity of home sales,” said Alec Traub, a Redfin Los Angeles agent. “In the past, buyers had to wait for their agent to tell them which homes were for sale. Now, when I meet a client for the first time, they already have a home in mind and I can jump in to guide them on what it will take to win it.”
Various Redfin agents recommend buyers provide assurances to both the seller and listing agent by working with a local, reputable lender and catering to the seller’s needs. This can ensure they don’t miss out on a home once they’re ready to make an offer.
Continue reading.

by LLT | Apr 14, 2017 | LLT, News
 Rates dip to new 2017 lows
Mortgage rates continued to steadily decline, maintaining a recent downward trend in rates, according to Freddie Mac’s latest Primary Mortgage Market Survey.
In fact, Sean Becketti, chief economist with Freddie Mac, said, “Not only did the average 30-year fixed-rate mortgage decline for the fourth consecutive week in our survey, it also fell to a new 2017 low.”
The chart below gives an overview of how mortgage rates have moved since April 2016.

(Source: Freddie Mac)
The 30-year fixed-rate mortgage averaged 4.08% for the week ending April 13, 2017, down from last week’s average of 4.10%. A year ago at this time, the 30-year FRM averaged 3.58%.
Similarly, the 15-year FRM this week averaged 3.34%, falling from last week’s average of 3.36%. A year ago at this time, the 15-year FRM averaged 2.86%.
The 5-year Treasury-indexed hybrid adjustable-rate mortgage averaged 3.18% this week, declining from an average of 3.19% last week. A year ago, the 5-year ARM averaged 2.84%.
Read the full article.

by LLT | Apr 12, 2017 | LLT, News

So you want to buy house? It will be stressful, but having a plan and collecting the right documents from the start can ease the pain. Here’s a step-by-step guide laying out what you’ll need for a smooth first-time buying experience.
Start saving for your down payment ASAP. Most private lenders require a 20% down payment to secure a mortgage. That means you’ll need over $45,000 for the typical home sold in America today. The requirements for a loan backed by the Federal Housing Authority can be lower, but 20% is still a good rule of thumb since the higher your down payment the lower your monthly mortgage payments and the more equity you start with. Aim to have your down payment in cash when you start your search or at least a plan to get there. Keep in mind that some lenders also require you have funds on reserve after closing, so your down payment should not wipe out every penny you’ve got. A typical ask might be 12 months worth of mortgage payments, how much of that needs to be in cash varies by lender.
Check your credit score six to 12 months in advance. Your FICO score can determine whether you qualify for a mortgage and what interest rate you’ll pay. It’s now easy to pull your score for free. These days you’ll need around a 620 for a lender to consider you at all and a 780 to get the lowest rates. You’ll want to check early because improving your credit will take time. If you have no credit history, for example, lenders like to see at least six months of consistent credit payments before considering you for a mortgage. Recovering from a credit mishap can take even longer, since derogatory marks stay on your credit report for seven years. If you don’t qualify for a competitive rate consider waiting to buy until you’ve improved your credit situation since a better rate can save you thousands of dollars over the life of a loan. How to improve your score will vary, sites like Credit Karma provide personalized tips.
Get pre-qualified by a lender three to six months ahead. The pre-qualification process will tell you roughly how much money a lender will give you. (Note that your lender may pre-qualify you for a larger loan than you are comfortable paying off. No matter how much you qualify for stick to a budget that suits your needs.) Most lenders will make pre-qualification estimates based on information you provide about your income and assets through an online portal, and sometimes a credit check. Unless you are self employed you typically aren’t required to provide documentation at this point. However, it is a good idea to start gathering the necessary paper work early so you can act quickly when you find the right home. This is especially true in markets where inventory is tight, which is the case in many places today. Requests vary by lender but a typical loan application will include something like: two years of tax returns, two years of W-2s, one month of pay stubs and two months of bank and investment statements.
Continue reading.

by LLT | Apr 11, 2017 | LLT, News
 For the past few years, the housing market has been unbalanced. Strong demand and lean supply keep pushing prices higher and higher.
On Wednesday, a fresh piece of data confirmed that trend. The Mortgage Bankers Association’s weekly purchase loan data showed that the average size of a home loan was the largest in the history of its survey, which goes back to 1990.
Higher prices have a few different effects on the market. Buyers have to make tradeoffs on the kinds of homes they can afford, or may be shut out of ownership altogether.
They may also adjust their borrowing. Larger mortgage sizes may reflect not just more expensive properties, but also more leveraged ones.
The 20% down payment is a relic: the median down payment in 2016 was 10%. For first-time buyers, it was 6%. First-timers and other buyers of less-expensive homes are more leveraged now than they were at the height of the housing bubble a decade ago.
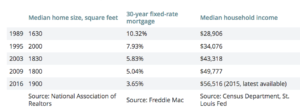
Home loan sizes aren’t the only things that have changed in the years since MBA started its survey. Back at the start of the survey, the median mortgage size was only about 3.3 times the median annual income. It’s now over five times as big – though buyers get bigger homes and lower interest rates.
Here’s a look at some housing market characteristics for select years.
Read the full article.


Recent Comments